Deep SEO/GEO field guide
How to Compare Lead Quality Before and After a Contractor Website Redesign
Compare contractor lead quality before and after a website redesign without confusing source mix, seasonality, response time, or tracking changes with results.
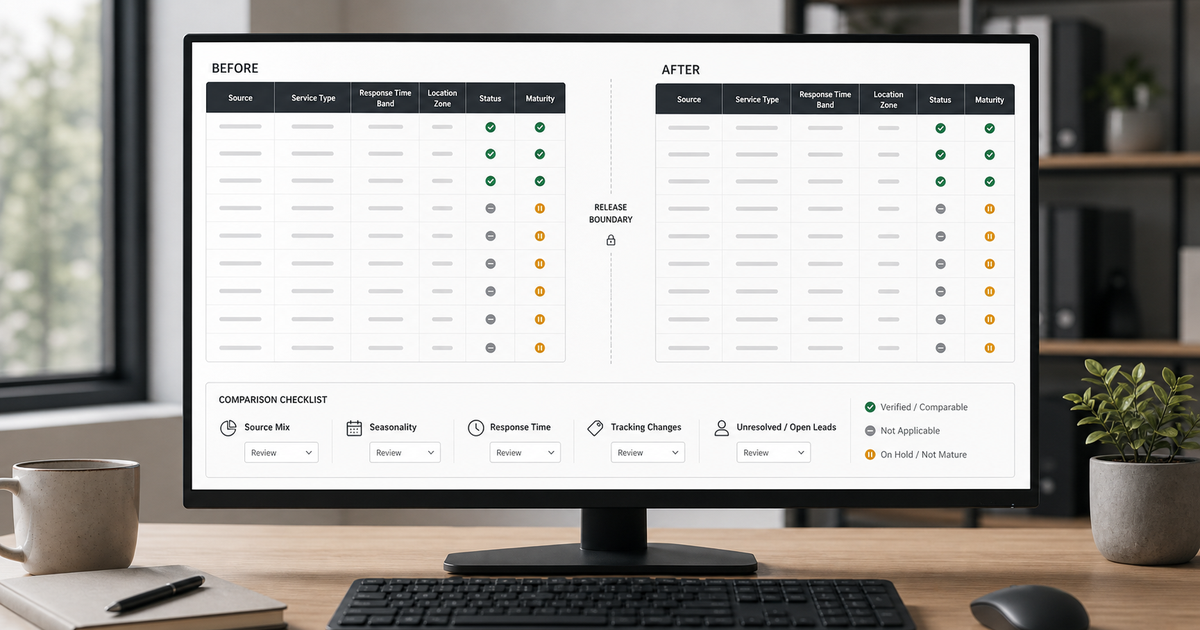
The redesigned website launches on Monday. Two weeks later, the dashboard shows more form submissions but fewer booked jobs. Was the new form worse? Did traffic change? Did the office respond more slowly? Or are the jobs simply too early in the sales cycle to count?
A single lead conversion rate cannot answer those questions.
The useful comparison starts with matched records, stable definitions, and enough context to separate a page change from everything else that changed around it. Otherwise, a clean before-and-after chart can support the wrong decision.
Short answer
To compare lead quality before and after a contractor website redesign, define the release time, choose comparable pre- and post-release windows, preserve each inquiry's source and first timestamp, and use the same outcome definitions on both sides. Segment by service, location, device, campaign, operating hours, and response-time band before interpreting the total.
Do not call the redesign a success or failure while many post-release leads are still open. Do not treat spam removal, tracking repairs, budget changes, or storm demand as page effects.
A defensible review should show:
- Which records belong in each comparison window.
- Which fields or tracking rules changed at release.
- How many inquiries were valid, reachable, estimated, booked, lost, or unresolved.
- Whether source mix, service mix, geography, staffing, or response time changed.
- What the evidence supports, what it only suggests, and what remains unknown.
The goal is a decision the contractor can explain, not a dramatic percentage.
Start with a release boundary you can prove
“We launched in May” is too vague for a record-level comparison.
Capture the production release time, time zone, deployment identifier, and the first verified moment the new form was live on the public domain. If a staged rollout, cache, campaign page, or third-party embed kept the old version active, record that overlap.
Useful release fields include:
website_release_at_utcwebsite_release_at_business_timeform_version_beforeform_version_afterpages_changedtracking_changesrouting_changesknown_overlap_end
Assign a form version to each inquiry from captured evidence when possible. A create date is only a fallback because retries and cached pages can cross the release boundary.
Choose windows that can actually be compared
A seven-day pre-period and a seven-day post-period may look balanced but still be misleading.
The windows should cover the same days of week and similar operating patterns. For many contractors, Monday morning behaves differently from Saturday evening. Holiday weeks, severe weather, seasonal maintenance peaks, and paid-campaign launches can overwhelm a page-level signal.
Start with one of these structures:
- Matched weekdays immediately before and after release, with the release day excluded.
- Four complete weeks before and four complete weeks after, if volume supports it.
- The same calendar period from the prior year, when strong seasonality makes adjacent weeks unsuitable.
- A service-specific window for campaigns that only run during part of the year.
Document why the windows were chosen. If no comparable window exists, say so. A trend view may still be useful, but it should not be presented as a clean redesign test.
Keep the denominator stable
The lead conversion rate changes when the denominator changes, even if customer behavior does not.
Before the redesign, the report may have counted every form submission. After the redesign, a spam filter may remove bots before they enter the CRM. Or the new integration may create a lead only after email validation. A higher booking rate can result simply because low-quality rows disappeared from the denominator.
Define the population explicitly:
| Population | Example definition |
|---|---|
| Raw submissions | Every captured form event, including tests and spam |
| Reviewable inquiries | Rows with enough evidence to assess |
| Valid service inquiries | Real requests within the business's service scope |
| Reachable inquiries | Valid requests with a usable contact route |
| Sales-ready inquiries | Valid, reachable requests that meet the business's intake criteria |
Report more than one denominator when it clarifies the change. For example, show booked jobs divided by raw submissions and by valid service inquiries. Do not switch silently from one to the other.
Rebuild outcomes from evidence, not labels alone
CRM statuses often drift across a redesign.
The old workflow may use Contacted, Quoted, and Won. The new workflow may add Qualified, Appointment Set, or automation-driven stages. Comparing stage names directly can make the new process appear more complete even when the underlying customer events are the same.
Use customer-visible or operational events:
- First human reply or completed call.
- Appointment scheduled.
- Site visit completed.
- Estimate sent.
- Customer declined.
- Job booked or deposit received.
- Explicit invalid reason such as wrong service or outside area.
- Still open with a defined next action.
Keep the original CRM status beside the reconstructed outcome. If evidence is missing, use unknown rather than selecting the nearest label.
Compare source mix before blaming the form
A redesign often launches alongside marketing changes.
Paid search budgets move. A Local Services Ads campaign pauses. A storm creates more organic emergency traffic. A referral partner sends a batch of larger projects. Social ads introduce a different device and intent mix.
At minimum, segment by:
- Paid search, organic search, local listing, referral, direct, social, and unknown.
- Campaign and landing page when available.
- New versus returning visitor only when the tracking basis is consistent.
- Call, form, chat, booking widget, or another intake channel.
If the post-release period has a different source mix, calculate source-specific outcomes before reading the total. A redesign can perform better within each source while the blended total declines because a lower-converting source became a larger share.
That pattern is sometimes called a composition effect. The plain-English explanation is enough: the mix changed, so the total is not a like-for-like page comparison.
Match service type and job urgency
Ten emergency plumbing calls and ten kitchen-remodel requests do not mature on the same schedule.
Service type affects response urgency, estimate process, job value, and time to booking. A redesign that promotes financing or project galleries may attract more long-cycle work. An emergency call button may do the opposite.
Create stable service groups that exist on both sides of the release. Do not map every new option to an old category unless the relationship is clear.
For each group, compare:
- Valid inquiry share.
- Median time to first human response.
- Estimate or appointment rate.
- Booking rate among mature inquiries.
- Invalid and out-of-scope reasons.
- Open records that have not reached an outcome yet.
Keep revenue separate unless the accounting window is complete and the source link is reliable. A booked job is not the same as collected revenue.
Measure response time before judging lead quality
The website does not control what happens after submission.
If the office responded within ten minutes before the redesign and two hours after it, a lower booking rate may reflect staffing or routing. The new form might even collect better information while the handoff performs worse.
Build response-time bands using the first verified customer inquiry and first verified human response:
- Under 15 minutes.
- 15 to 60 minutes.
- 1 to 4 hours.
- Same business day.
- Next business day or later.
- No verified response.
Compare outcomes inside the same response band. Keep automated acknowledgments separate from human responses unless the analysis is specifically about automation.
Also segment operating-hours and after-hours inquiries. A Saturday night emergency request should not be compared with a Tuesday morning estimate form without acknowledging the service model.
Control for geography and service-area changes
Redesigns often add location pages or broaden a service-area selector.
That can increase submissions outside the practical drive area. It can also expose an old routing problem where a ZIP code maps to the wrong branch.
Use the submitted service location, not the visitor's IP location, when the field is available and appropriate. Group records into stable service zones:
- Core area.
- Extended area.
- Outside area.
- Missing or unresolved location.
If the service boundary changed during the comparison, report the old and new rules. Do not label newly accepted areas as lower-quality leads simply because the old team would have declined them.
Separate tracking repairs from customer behavior
A redesigned site may fix broken analytics, call tracking, duplicate events, or missing hidden fields. That is valuable, but it creates a measurement break.
Examples include:
- A form that previously fired two conversion events now fires one.
- Call tracking begins recording mobile click-to-call events correctly.
- A confirmation page no longer reloads and duplicate-counts.
- UTM values start surviving into the CRM.
- Spam and test submissions receive explicit labels.
- A chat vendor starts creating CRM records.
List each measurement change in the release register. When the same metric is not collected the same way before and after, do not draw a straight trend line through the break.
You may need two views: an operational lead review using the best available record evidence, and an analytics view that starts fresh after the new tracking baseline.
Control for seasonality in lead conversion data
Seasonality is not only about monthly volume.
Storms can shift roofing inquiries toward urgent repairs. The first heat wave can flood HVAC dispatch. School schedules affect remodeling consultations. Holiday weeks change both customer behavior and staff coverage.
To control for seasonality in lead conversion data, annotate known demand events and compare the same service categories across more than one time window. Use prior-year data only when definitions and tracking are compatible. If they are not, preserve the prior-year numbers as context rather than treating them as a control group.
A practical table can include:
| Period | Weather or seasonal event | Spend change | Staffing change | Service mix change | Comparable? |
|---|---|---|---|---|---|
| Pre 1 | Normal week | None | Full team | Stable | Yes |
| Pre 2 | Holiday | None | Reduced hours | Stable | No |
| Post 1 | First heat wave | HVAC budget up | Full team | Emergency-heavy | Partial |
| Post 2 | Normal week | Stable | Full team | Stable | Yes |
Excluding a period is acceptable when the reason is documented before reading the outcome. Quietly removing an inconvenient week after seeing the numbers is not.
Do not close the post-release window too early
A new lead can be valid and promising without being booked yet.
Choose a maturity rule for each service type. Emergency repairs may resolve quickly. Replacement roofing, remodeling, or commercial work may require site visits and revised estimates.
At the review date, separate:
- Mature records with a final outcome.
- Open records with a next action and due date.
- Open records with no visible next action.
- Records held for missing context.
Do not count every open record as lost. Do not count every estimate as booked. Show the unresolved share so the contractor knows how much of the post-release result can still change.
Use small samples to audit the measurement before the metric
A contractor website form conversion audit should inspect records before producing a dashboard.
Take a bounded sample from both sides of the release. Include clean rows and awkward ones:
- One after-hours inquiry.
- One duplicate or repeat request.
- One out-of-area request.
- One paid campaign lead.
- One organic or direct inquiry.
- One record with a fast response.
- One record with no verified response.
- One long-cycle estimate still open.
Trace source, form version, timestamp, first response, current owner, next action, and outcome evidence. If the sample cannot be reconciled, a larger chart will only scale the ambiguity.
A comparison table that does not overclaim
Use counts alongside rates:
| Measure | Before | After | Comparison note |
|---|---|---|---|
| Raw submissions | Tracking definition unchanged? | ||
| Valid service inquiries | Same validation rules? | ||
| Reachable inquiries | Contact fields collected the same way? | ||
| Human response verified | Same response definition? | ||
| Appointment or estimate | Same event and maturity window? | ||
| Booked job | Same booking evidence? | ||
| Still open | Post-release rows mature enough? | ||
| Unknown or missing context | Data quality improved or worsened? |
Add segment tables for source, service, geography, device, and response-time band only when the counts support them. Tiny segments can help find records to inspect, but they should not be presented as stable performance estimates.
How AI Cleanup Doctor can review the handoff evidence
AI Cleanup Doctor can review a redacted sample of up to 25 lead rows without requiring a CRM login. A useful redesign sample includes form version, source page, source/campaign, service type, submitted time, operating-hours flag, first human response, location zone, current status, next action, and outcome evidence.
Remove names, phone numbers, email addresses, message details, and other personal data that are not needed for the comparison.
The review can identify definition breaks, duplicate candidates, missing response evidence, unresolved outcomes, source-mix shifts, and rows that should remain on hold. It can also produce a field checklist for a larger internal analysis.
The review cannot prove that the redesign caused an increase or decrease from a small observational sample. It does not replace analytics validation, controlled testing, legal review, or the contractor's final business judgment.
Decide what to change next
The finding should point to a specific owner and action.
- If valid inquiry rate falls within the same source and service mix, inspect form friction and field requirements.
- If response time worsens, repair routing, staffing, or notification ownership before redesigning again.
- If out-of-area inquiries rise, check location targeting and service-area copy.
- If tracking definitions changed, establish a new baseline rather than forcing a historical trend.
- If post-release records are immature, schedule the next review date.
- If the sample is too small, keep collecting comparable records and avoid a permanent decision.
That is how to compare lead quality before and after a website redesign without pretending every difference came from the page.
Frequently asked questions
How long should we wait before comparing conversion after a redesign?
Wait long enough for the service type to reach a normal outcome. Emergency work may mature quickly; replacement, remodeling, and commercial estimates often take longer. Report mature, open, and unknown records separately rather than choosing one universal wait time.
Should spam leads be removed from both periods?
Use the same documented validation rule on both sides. Keep raw-submission counts so a new spam filter does not disappear from the analysis. If old spam cannot be classified reliably, label the limitation instead of forcing parity.
Can analytics conversion events replace CRM outcome review?
No. Analytics can show a submitted form, call click, or booking event, but it may not show whether the request was valid, reachable, estimated, booked, duplicated, or out of scope. Use both systems with clear definitions.
What if ad spend increased at the same time as the redesign?
Compare source and campaign segments, record the spend change, and avoid attributing the blended result to the site alone. A different traffic mix can change total conversion even when page performance inside each source remains stable.
Is a higher lead conversion rate always better?
Not by itself. The denominator, service mix, job value, response process, maturity window, and validation rules matter. A higher rate from a smaller or narrower population may not produce more useful work.
Can this analysis prove the redesign caused the result?
Usually not from ordinary before-and-after data alone. It can reveal consistent patterns, measurement breaks, and operational changes. Stronger causal claims require a suitable experiment or other rigorous design with enough comparable data.